Tuesday January 12, 2021 | VICTORIA, BC
by Kiley Verbowski | Island Social Trends
Canadians are reporting the lowest level of life satisfaction since Statistics Canada first began collecting data in 2003, with an overall rating of 6.71 in 2020. In 2018, the average response was 8.09, and this decrease is similar to results observed in the United Kingdom.
Between August and December 2020, researchers asked 4,200 Canadians a simple question: On a scale of zero (meaning very dissatisfied) to 10 (very satisfied), how do you feel about your life as a whole right now? Of course, 2020 was the year of the COVID-19 pandemic (which continues into 2021).
In 2018, 72 per cent of respondents (from a much larger sample size of 49,200 people) answered with an eight, nine, or 10, but in 2020 only 40 per cent of respondents answered that way. At the other end of the scale, responses between zero and six comprised only 12 per cent of responses in 2018, while the newest data found 40 per cent of Canadians rating their overall life satisfaction at a six or less.
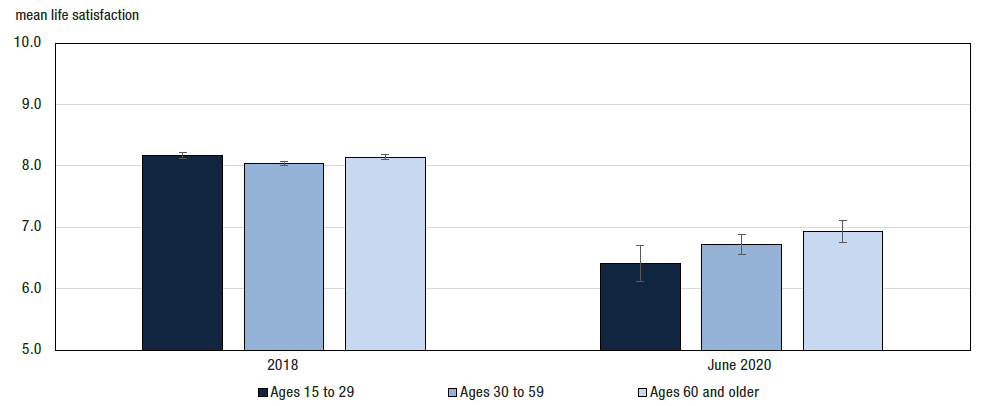
Life satisfaction by age group:
Typically, the age distribution of this question creates a “U” shape, with people age 30 to 59 years responding with the lower scores. In 2020 during the COVID pandemic, the graph took on a staircase shape, with the scores of people aged 15 to 29 dropping by 1.76 points, taking on the lowest average score.

British Columbians in this demographic were up to three times more likely to lose their job during the pandemic, and 35 per cent of people in that age bracket hold low-paid and temporary employment, which is the most susceptible to economic crisis, according to a study by the Organization for Economic Co-operation and Development. The study also states that, “as illustrated by previous economic shocks, young people graduating in times of crisis will find it more difficult to find decent jobs and income, which are likely to delay their path to financial independence.”
Psychological impacts like stress, anxiety, and loneliness stemming from social-isolation were significant for people ages 18-29 in 2020 due to the pandemic, according to another study. The study found that levels of distress among this demographic have been higher than any other demographic since the onset of the pandemic.
For secondary school students, the postponement or cancellation of high stakes final exams has exposed teenagers to uncertainty, stress, and anxiety about the future, which are compounded by the realities of climate change that they already face.
Adults age 60 and older reported the highest numbers (i.e. greater level of satisfaction), although they are still 1.21 points lower than 2018 responses on average. This is likely due to overall greater financial stability as well as life experience for dealing with the sudden and unprecedented impacts of the pandemic.
It is important to note that neither the 2018 or 2020 data included people living in seniors’ residences or long-term care facilities.
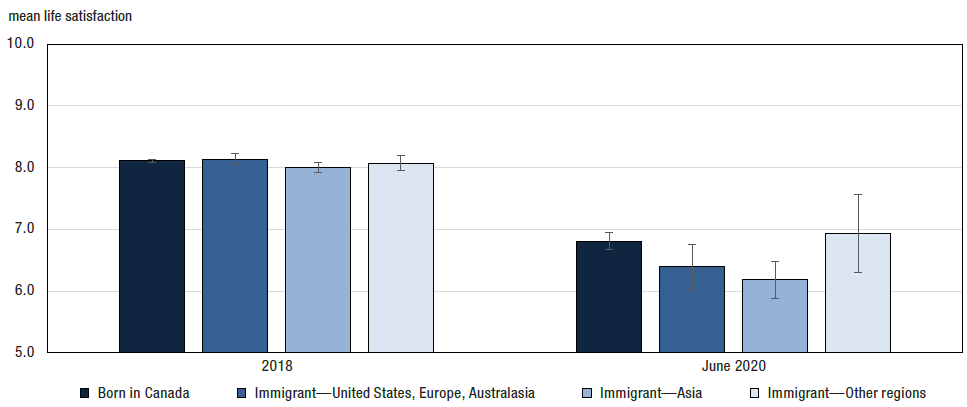
Life satisfaction by immigrant status:
The 2018 data showed little discrepancy between respondents born in Canada and those born elsewhere, but 2020 data shows significant differences.
Immigrants from Asia reported the largest decrease, followed by immigrants from the United States, Europe, and Australasia, than people who were born in Canada.

Regional unemployment rates indicate that labour market experiences during the pandemic were a contributing factor, but social factors are also at play. Notably, 41 per cent of immigrants from Asia reported being fearful of being the target of intimidating behaviours during the pandemic because of people judging them as an increased risk to others. Only 17 per cent of respondents born in Canada expressed the same fears.
The Vancouver Police Department reported a 600 per cent increase in reports of hate crimes targeting the Asian community, whether they’re of Chinese, Korean or Japanese descent. However, British Columbia’s Anti-Racism Network says that discrimination is nothing new, but rather more people feel comfortable airing racist opinions that they may have held silently before.
Life satisfaction by sex:
In 2018, the difference of life satisfaction between men and women differed by 0.01 points, at 8.10 and 8.09 respectively, and have decreased with very little variability between groups.
This has changed during the pandemic due to more women essentially falling out of the workplace due to being in predominantly service-industry jobs and/or staying home to care for children.
Factors such as household composition, education, and urban or rural residence did not change life satisfaction responses significantly during the pandemic.
Editor: Mary P Brooke, Island Social Trends


